When setting up your Conversion Bid Strategy, you will have the option to “Run Experiment,” which will set up an A/B test between the Conversions bid strategy and a control group of standard traffic.
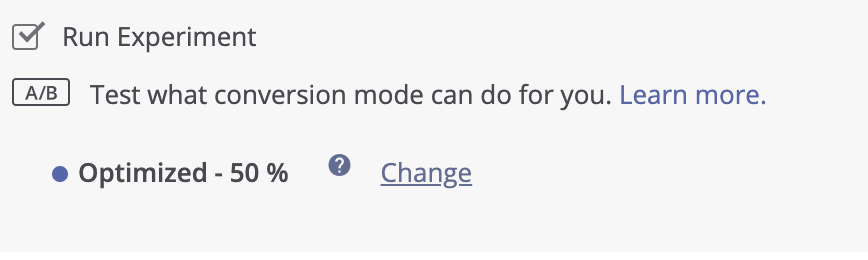
You can adjust the testing ratio up to 80%-20% in either direction.
If you elected to run an A/B test, you can find your campaign’s test results in the dashboard. Head back to your campaign name in the main Campaigns view, and you should see a column named “Objective & Strategy” that will note if an A/B test is enabled.
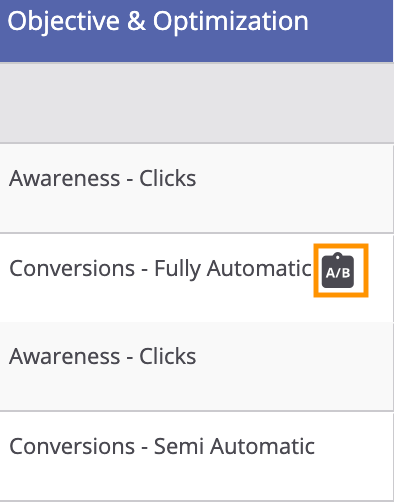
Click this button to open your A/B test results, although make sure to let the test run for at least a few days to gather enough data. The results will appear where your campaign chart had been.
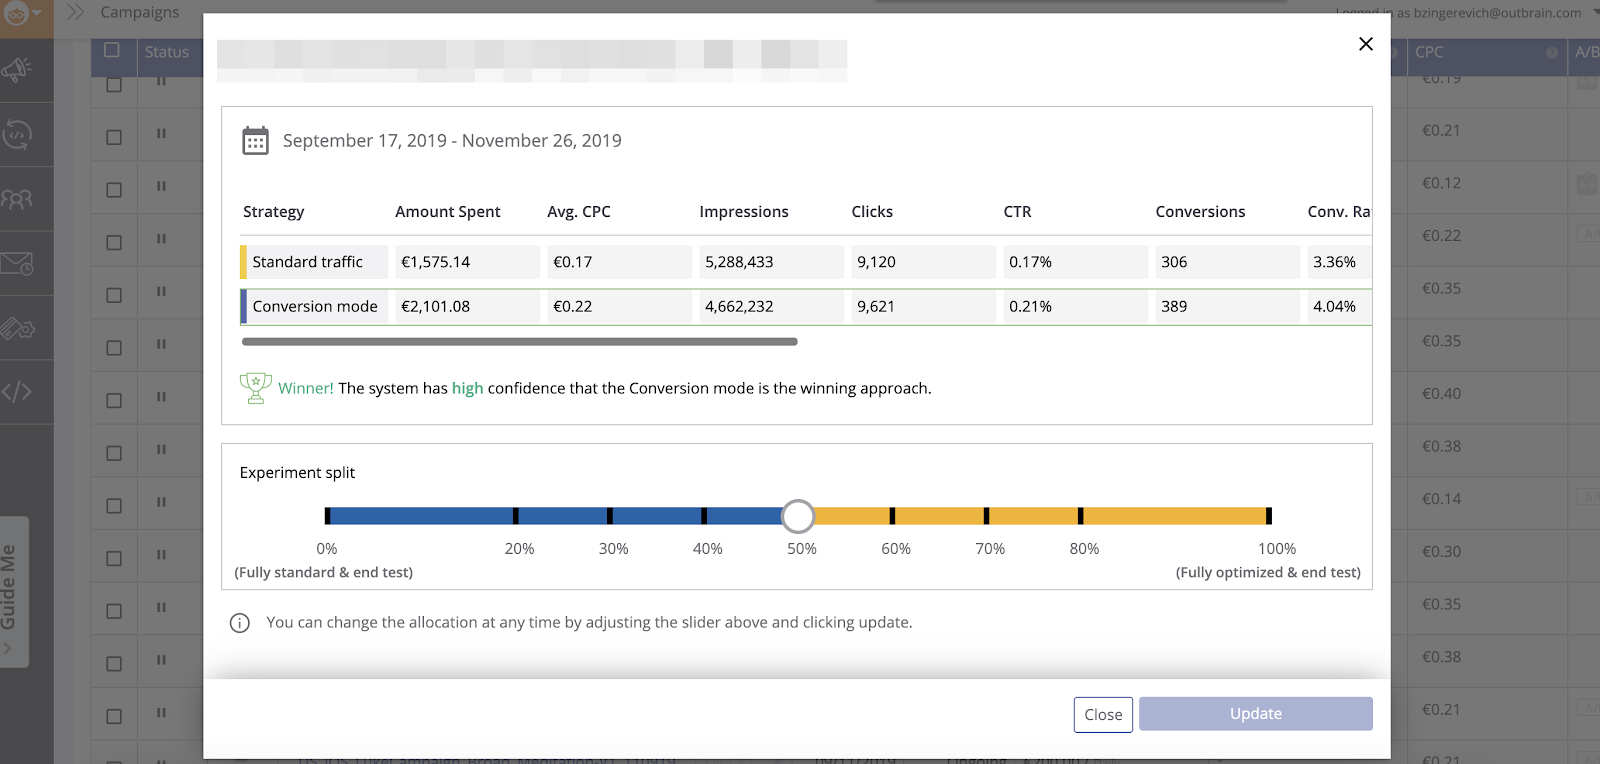
On this window, you can view the results of the A/B test as well as make adjustments to the Experiment (by either making the test more standard or optimized).
You can also select the Calendar icon in the upper left if you’re running multiple experiments and want to view a different experiment’s results.
If you’re optimizing toward more than one conversion, you can scroll to the right to view the test performance breakdown by each conversion.
You may see a difference between the number of counted conversions and your total conversions for the campaign. Only the conversions auto-optimized during the test are shown here. Conversions from manual bids are not included.

Under the A/B test results, you can see the Confidence ranking for the test. This depends on the amount of traffic you have received and the amount of time you have run your test. The Confidence Level indicates how statistically confident we are that the results of the A/B test are accurate. The higher the rating the better!
- A high confidence rating (95%-100%), shown in green, indicates that the A/B test will very likely continue to show the same results.
- Medium confidence rating (75%-95%), shown in yellow, indicates that the A/B test will probably continue to show the same results.
- A low confidence rating (75% or lower), shown in red, indicates that the system needs to gather more data in order to choose the winning variant.
- Pixel means the conversion pixel has not been implemented properly and may have led to a discrepancy in reporting.
- Data is still collecting means our system does not have enough conversions to optimize, more information for that below.
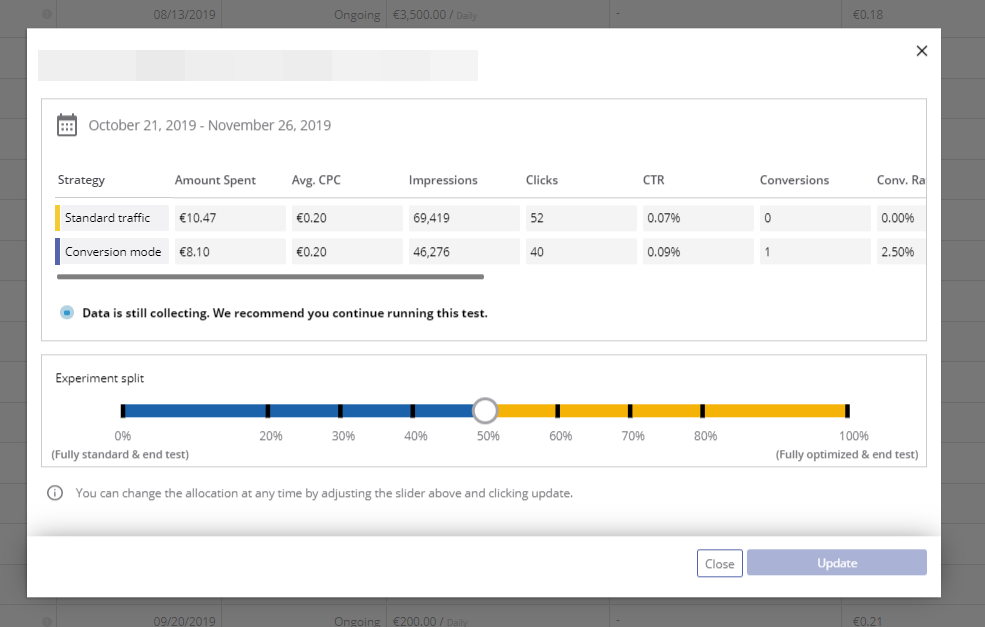
In the case of not collecting enough data, we recommend that you:
- Wait to collect at least 20 conversions. The test can’t run properly without enough conversions. Try running the campaign for a longer period of time and take a look at our tips and tricks for getting more conversions!
- Make sure the campaign is receiving enough traffic. If you’re having trouble scaling your campaigns, take a look at this guide.
- Consider removing the CPC adjustments to allow the system to dynamically adjust those publisher sections. Your campaign may have too many manual CPC adjustments, which override the Conversions bid strategy.
Finally, in the Experiment Split section, you can choose to end the test, by either applying Fully Optimized mode (shifting completely to the right) or by reverting to Fully Standard mode (shifting completely to the left).
We recommend waiting until the test has gathered enough data before you decide.
Once ready, go ahead and select your choice! For more information regarding Conversion Bid Strategy, please reference this Help Center article.