Do you want a real time view of how your campaign is performing? Outbrain’s Live Data view and Realtime Data tab show live changes in your campaign’s impressions, spend, average CPC, average CPA, click-through-rate, conversion-rate, as well as clicks and conversions.
Real-time data views allow you to quickly confirm a campaign has launched, monitor spend drops and increases, and immediately see the impact of your campaign adjustments.
In the Amplify dashboard, you are able to access real-time data two different ways:
- Directly in the main dashboard view
- Via dedicated Realtime Data tab
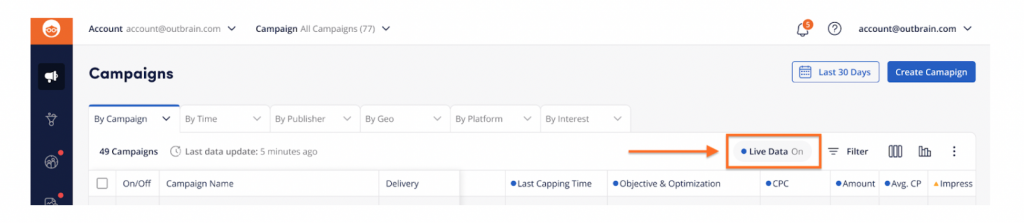
1. Main dashboard Live Data view:
Live Data is reflected in the reporting tables and is available on every reporting dimension and the reporting graphs. It’s enabled by default, but you can turn it off by turning off the toggle switch on the right hand-side of the Amplify dashboard:
Live Data is available in 5-10 minutes intervals and you can see the last time the data was refreshed by hovering over the toggle button: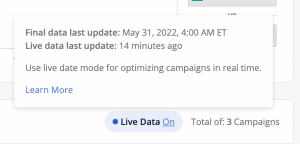
2. Realtime Data tab:
You can access the Realtime Data view on the left-hand side of the Amplify Dashboard.
What is shown in the Realtime Data view?
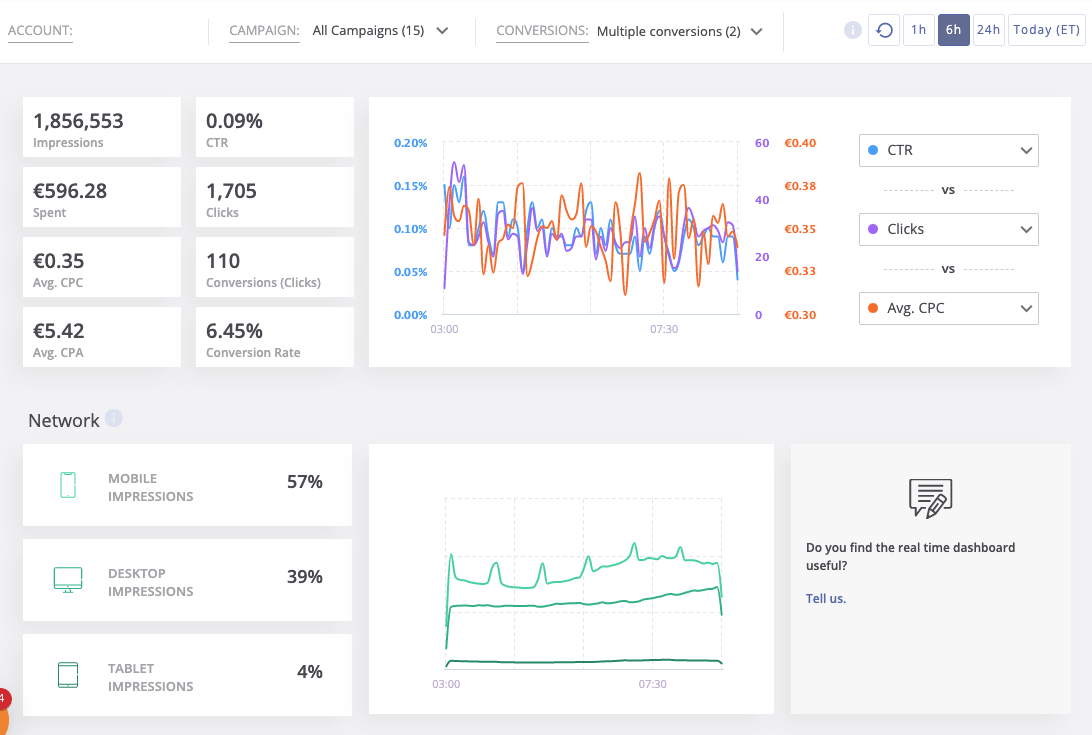
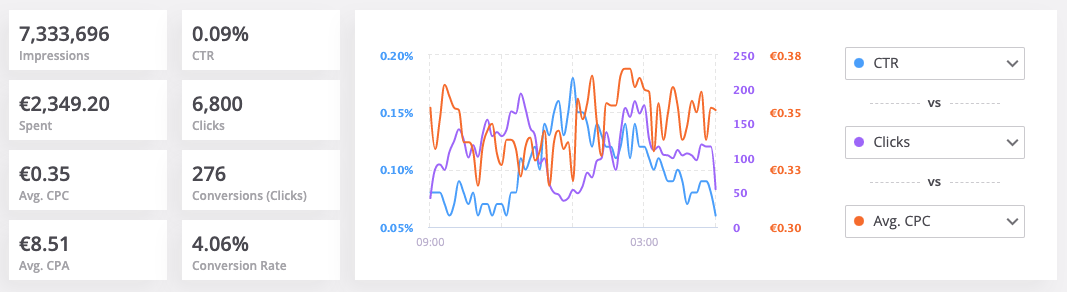
The top half (shown below) of the Realtime Data view shows your campaign metrics in real time, including impressions, spend, average CPC, average CPA, click-through-rate, conversion-rate, as well as clicks and conversions. You can adjust this view to show trends over the past hour, 6 hours, and 24 hours.
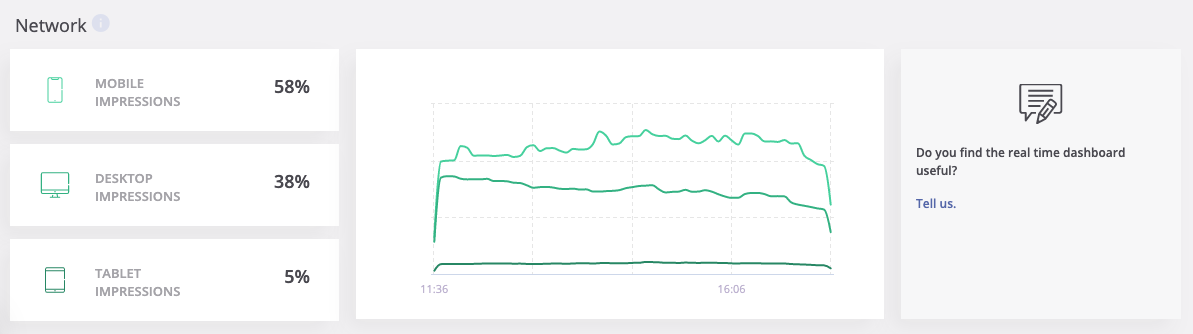
The bottom half (pictured below) shows network-level trends across Outbrain, specifically traffic over time across mobile, tablet, and desktop. This view can also be refreshed to show the past hour, 6 hours, and 24 hours.
How can I use the Live Data & Realtime Data tab for my campaigns?
- Assess the impact of campaign changes: Immediately analyze how changes to your campaign CPC, creatives, bid strategy, and more impact your overall campaign performance in real time.
- Confirm that your campaign has launched: Check Live Data to verify that your campaign has begun spending, especially around time-sensitive events and offers.
- Quickly troubleshoot spend drops and spikes: Keep a pulse on your campaign spend over time, and more quickly adjust your campaign strategy.
- Monitor network fluctuations: See minute-by-minute changes to Outbrain network traffic across various platforms (mobile, desktop, tablet) to capitalize on surges across various times of day and events.
What time zone is the data displayed in?
Real-time data is displayed in your local browser’s timezone. This is notably different from our standard Amplify dashboard reporting, which is displayed in Eastern Time.
If there are delays in standard Amplify dashboard/campaign reporting, will real-time data also be delayed?
No- a large benefit of our Realtime Data reporting capability is the fact that it remains unaffected when any delays may occur within standard Amplify dashboard reporting.